The 12 Traits of Highly Profitable Trucking Companies: The Strength of Weak Ties – Using Connector Freight To Improve Network Profitability
KSM Transport Advisors (KSMTA) has worked with over 200 trucking companies since our inception. Our primary service focuses on guiding trucking company leaders in understanding their freight network and determining strategies to improve the density, velocity, and ultimately the profitability in their geographic footprint. In delivering this service, the KSMTA team has observed and documented 12 key traits of highly profitable trucking companies.
This article is part of a series highlighting the key traits and focuses on trait number seven of 12.
In business, networking and forming connections are crucial for success. While strong ties with close customers, colleagues, and trusted partners are undeniably valuable, an often-underestimated resource lies in the strength of weak ties. Weak ties refer to connections that are less intimate or frequent but still hold significant potential for growth and opportunity. In trucking, a common weak tie is connector freight. Some may refer to connector freight as “backhaul,” but this is an outdated term that doesn’t capture the complexity of an irregular route OTR network. Connector freight has poor one-way attributes (i.e., low rates). However, when connector freight is used properly, it can connect good-to-good market areas in a disciplined freight network.
In every carrier’s freight network, there are islands of highly profitable freight that exist. These are considered key market areas. Key market areas are geographic regions of net positive goods production with an undersupply of capacity to serve that freight. However, accessing these bountiful areas can prove challenging. That’s where highly profitable carriers can use connector freight to successfully connect good-to-good (perhaps great-to-great) areas.
At face value, these connector loads may look awful. However, when examined from the perspective of network profitability, they may be the glue that holds that network together and mean the difference between black and red ink. Unfortunately, with less sophisticated carriers, they may not have the tools to evaluate freight from a network perspective, or they may be using a simplistic rule of thumb of “nothing lower than $X.XX per mile.” This view leads to an increase in opportunity costs (lost margin opportunity) and the collapse of any semblance of a freight network. Nothing is simple in trucking, so when you are using simple rules of thumb, there will be negative compound effects.
In an irregular route OTR network – when evaluating the performance of broker loads – our clients will typically generate significantly more margin on shipper loads versus broker loads. However, that is when they are being measured in isolation. In a disciplined freight network, those broker loads should be bookended by shipper loads in a trip or tour. Further, there are many shippers that can act like broker freight in a given network. Packaging companies are well-known to act like broker freight and, when used correctly, can bridge those key market areas in your network. A general rule of thumb is to limit exposure to connector or broker freight in any trip or tour on 1:3 basis (connector/broker : direct shipper loads).
In order to calculate the network profitability impact of a load, you must first evaluate the base statistics of that load – the one-way value. Our suggestion is to use a margin-driven measure. In our trucking consulting practice, we use a measure called Margin per Hour (MpH). This measure starts by subtracting the variable and direct costs associated with the loaded and empty movements of the load from the linehaul and fuel surcharge revenue. More details on this calculation can be found here. After calculating the gross margin associated with each load, we must now add time to the mix. Top performing carriers have long incorporated time into their measures of load-level profitability. An easy path to isolate the transit time associated with each load is to have the clock start ticking as soon as the truck (associated with the load being evaluated) becomes available on the prior empty call. The clock will continue to tick until the empty call on the load. Now we have Margin and Transit Time. The MpH calculation is as follows:

Once the true value of a given load has been determined (beyond rate per mile), the next step is to clarify if it added or stole profit to/from the network – and the P&L. To calculate Network Value (NV), we must aggregate all the loads and empties for the following:
- Into the origin area for the same time interval
- Out of the destination area for the same time interval
- Out of the expected future destination areas for the same time interval
Each of these segments can be weighted differently depending on the network, but the diagram below describes how to use simple arithmetic to calculate the Network Value of a load.
In the formula below:
- “r” refers to revenue
- “c” refers to cost (direct and variable)
- “t” refers to time
- “p” refers to previous
- “b” refers to base (the load being evaluated)
- “s” refers to subsequent (immediately following the base load)
- “f” refers to the expected future destinations, following subsequent loads
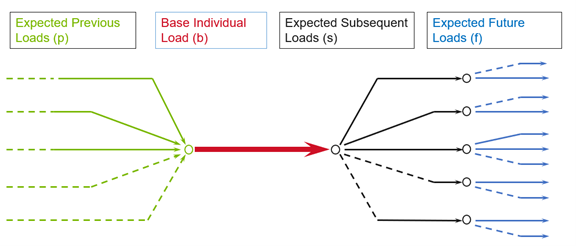
Network Value (NV) = (rp-cp + rb-cb + rs-cs + rf-cf) / (tp + tb + ts + tf)
At first glance, this may seem complicated; but this calculation determines the MpH (and Margin per Day) for the Base Load, as well as the aggregate of all the loads and empties that fall into the “p,” “s,” and “f” segments. This time-weighted average of the margins of all segments provides an index value of a load, which can then be rolled up (aggregated) for benchmarking purposes by lane, customer, and overall network.
Finally, to prioritize ideal actions to improve network profitability, customers and lanes can be categorized in a matrix format. The matrix below provides a powerful visual to understand the tightness and discipline (or lack thereof) of a given asset network. The X axis describes the one-way value of a load, lane, or customer (low to high, from left to right). The Y axis describes the calculated Network Value of the load (low to high, from bottom to top). Where the two lines intersect is the network average for one-way value and Network Value.
The upper-right quadrant includes the customers and lanes that have high one-way value and high Network Value. The best of the best in this quadrant would be described as franchise customers and lanes. Conversely, the bottom left quadrant is comprised of the bad apples – low, one-way value and low Network Value. The worst of these would be described as toxic customers and lanes.
Next, we look at the bottom-right quadrant. The lanes and customers in this category have strong one-way statistics but take carriers away from their core network, leading to a series of forced (bad) options to get back in the network. Finally, the upper-left quadrant is the connector freight. This category includes all the loads, customers, and lanes that have poor one-way value, but, because they are connecting to islands of freight profit, the overall Network Value is high.

A network cannot be built on cheap freight, but in a well-defined network and when transit time is factored into the decision process, subpar freight can be the glue that holds a network together and yields a lower operating ratio.
Our next article in The 12 Traits of Highly Profitable Trucking Companies series will highlight the key trait of “Network Discipline: Defining Your Power Versus Spider Lanes.”
To learn more or discuss any of the ideas shared above, please contact a KSMTA advisor or complete this form.
Related Content
Where Ownership
Meets Opportunity
At KSM, you’re more than an employee, you’re a firm owner.