Understanding Physician Compensation per wRVU Data in Light of 2020
Given the events of last year, it’s safe to say that the 2020 results of provider compensation and production surveys – due to be released in the coming months – will be unusual. But before the survey data is released, it’s important to remember what the data entails and how it’s best interpreted and utilized.
In order to align provider compensation more closely to work effort, many compensation models use general market rates that are paid per unit of measurable provider clinical work. We know these rates as compensation per work relative value unit rates, conversion factors, or simply comp/wRVU rates.
Just like total cash compensation and clinical cash compensation, comp/wRVU rates are published in well-known and commonly referenced national provider compensation and production surveys such as those published by:
- American Medical Group Association
- Medical Group Management Association
- SullivanCotter
- Gallagher Human Resources and Compensation Consulting
These published rates are commonly utilized to assess general market cash compensation levels to help ensure that providers are paid competitively and at levels that are considered consistent with fair market value (FMV) and that are commercially reasonable. The published comp/wRVU rates are also commonly referenced when designing compensation models that include wRVU productivity-based components.
Though comp/wRVU rate is common terminology, many who reference these published rates may not fully understand how the data is compiled and how the rates are calculated. Often, individuals assume that these rates are reported by the respondent organizations based on the rates they actually paid to providers per the compensation terms in the employment arrangements. For example, Organization X pays internal medicine physicians $50/wRVU per the compensation model in their employment agreements.
This is simply incorrect.
What is really happening behind the scenes is that the survey organizations distinguish the providers for which they have both total annual cash compensation data and total annual personally performed wRVUs. The survey sources then calculate each individual provider’s effective comp/wRVU rate, and those effective rates comprise the dataset. Not all providers have both total cash compensation and wRVU production reported, but generally it’s a substantial subset of the overall data, varying somewhat by specialty.
Understanding how the published comp/wRVU rates are calculated helps to appropriately interpret the market data, at least from a relatively high level. Because of the nature of ratios, high levels of cash compensation or low levels of wRVUs will generate a higher effective comp/wRVU rate and vice versa. There are several scenarios that can result in these dynamics producing effective comp/wRVU rates that are skewed to one end of the spectrum or the other:
- Providers are paid a guaranteed/base salary but are low producers, which yields higher effective comp/wRVU rates. This could include newly recruited providers who are recently out of training, those who moved into a new geographic location and are building a practice, or providers that are access-based and in a location that serves a need but not a significant patient population.
- Providers are highly productive where compensation does not have a linear relationship with production, which yields lower effective comp/wRVU rates. This could include highly productive providers that are paid primarily a guaranteed/base salary or providers who have a production incentive with comp/wRVU rate payments that are positioned closer to the median of the published data and/or whose production-based compensation is capped.
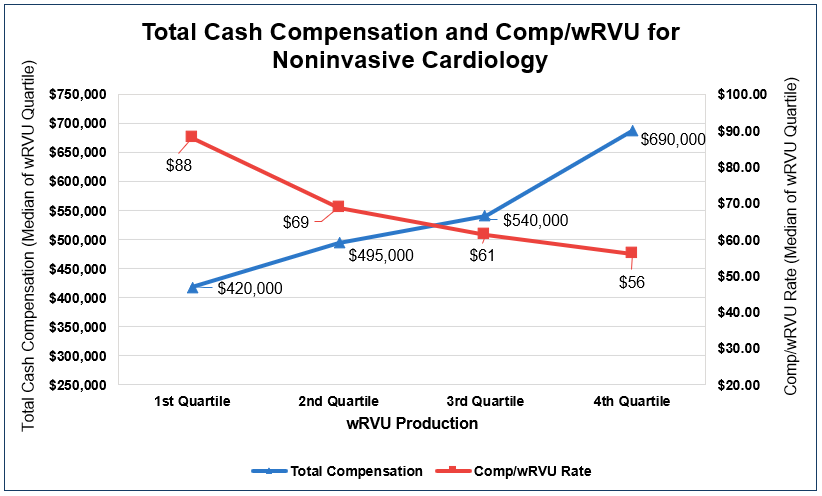
The following example graph, based on actual market data, helps illustrate this dynamic. It clearly displays that as compensation increased for noninvasive cardiologists, comp/wRVU rates decreased, demonstrating the inverse relationship between total cash compensation and comp/wRVU rates.
As an additional example, we have also calculated the imputed comp/wRVU rates for noninvasive cardiologists based on approximate weighted average national total cash compensation market data divided by approximate weighted average national wRVU production market data at the respective published percentile levels. For comparison purposes, we have also included the approximate weighted average national published comp/wRVU rates in the table.

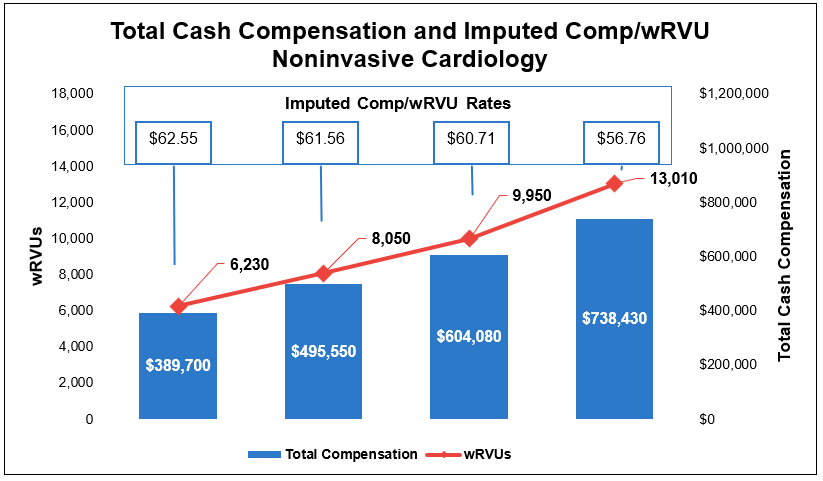
The table and graph both illustrate that there is correlation between wRVU production and total cash compensation, as displayed by the steadily declining imputed comp/wRVU rates. They also illustrate that there is a negative correlation between increases in compensation and production and imputed comp/wRVU rates. In other words, as wRVU production and compensation increase, comp/wRVU rates paid to providers tends to decrease. It’s also important to note that all of these imputed comp/wRVU rates are positioned relatively close to the approximate weighted average national published market data median of $63.50.
It should be noted that the imputed rate calculation and resulting imputed comp/wRVU rates are included only to help illustrate the dynamic between comp/wRVU rates and total cash compensation that is being investigated. We do not suggest that this is a statistically accurate method to interpret the market data.
So, what does it all mean?
Understanding the market data is critical. But the market data is just data – not a set of recommendations. The survey sources have included rates and ratios in order to provide additional insight into the reported compensation and production data, but these rates and ratios are calculated by the survey sources and not sourced from compensation models or agreement terms. When developing production-based compensation models and establishing comp/wRVU rates within those models, it’s important to consider not only the inverse relationship between total cash compensation and comp/wRVU rates but also the tendency of effective comp/wRVU rates to normalize toward the median of the published market data. In other words, if you have a compensation model that includes contractually paid comp/wRVU rates that differ significantly from the published median rate (e.g., ± 10-15% or more) and/or if you have a compensation model that includes comp/wRVU rates that increase as production increases, you may want to ask yourself why. Of course, compensation models can incorporate these types of elements while staying consistent with fair market value and commercial reasonableness standards, but it never hurts to check.
Related Content
Where Ownership
Meets Opportunity
At KSM, you’re more than an employee, you’re a firm owner.